Cisco Training Courses

Insoft has been serving IT community with official Cisco training offering since 2010. Find all the relevant information on Cisco training on this page.

View More

Cisco Certifications

Experience a blended learning approach that combines the best of instructor-led training and self-paced e-learning to help you prepare for your certification exam.

View More

Cisco Learning Credits

Cisco Learning Credits (CLCs) are prepaid training vouchers redeemed directly with Cisco that make planning for your success easier when purchasing Cisco products and services.

Have CLCs and want to redeem them?

Cisco Continuing Education

The Cisco Continuing Education Program offers all active certification holders flexible options to recertify by completing a variety of eligible training items.

View More

Cisco Business Enablement

The Cisco Business Enablement Partner Program focuses on sharpening the business skills of Cisco Channel Partners and customers.

View More

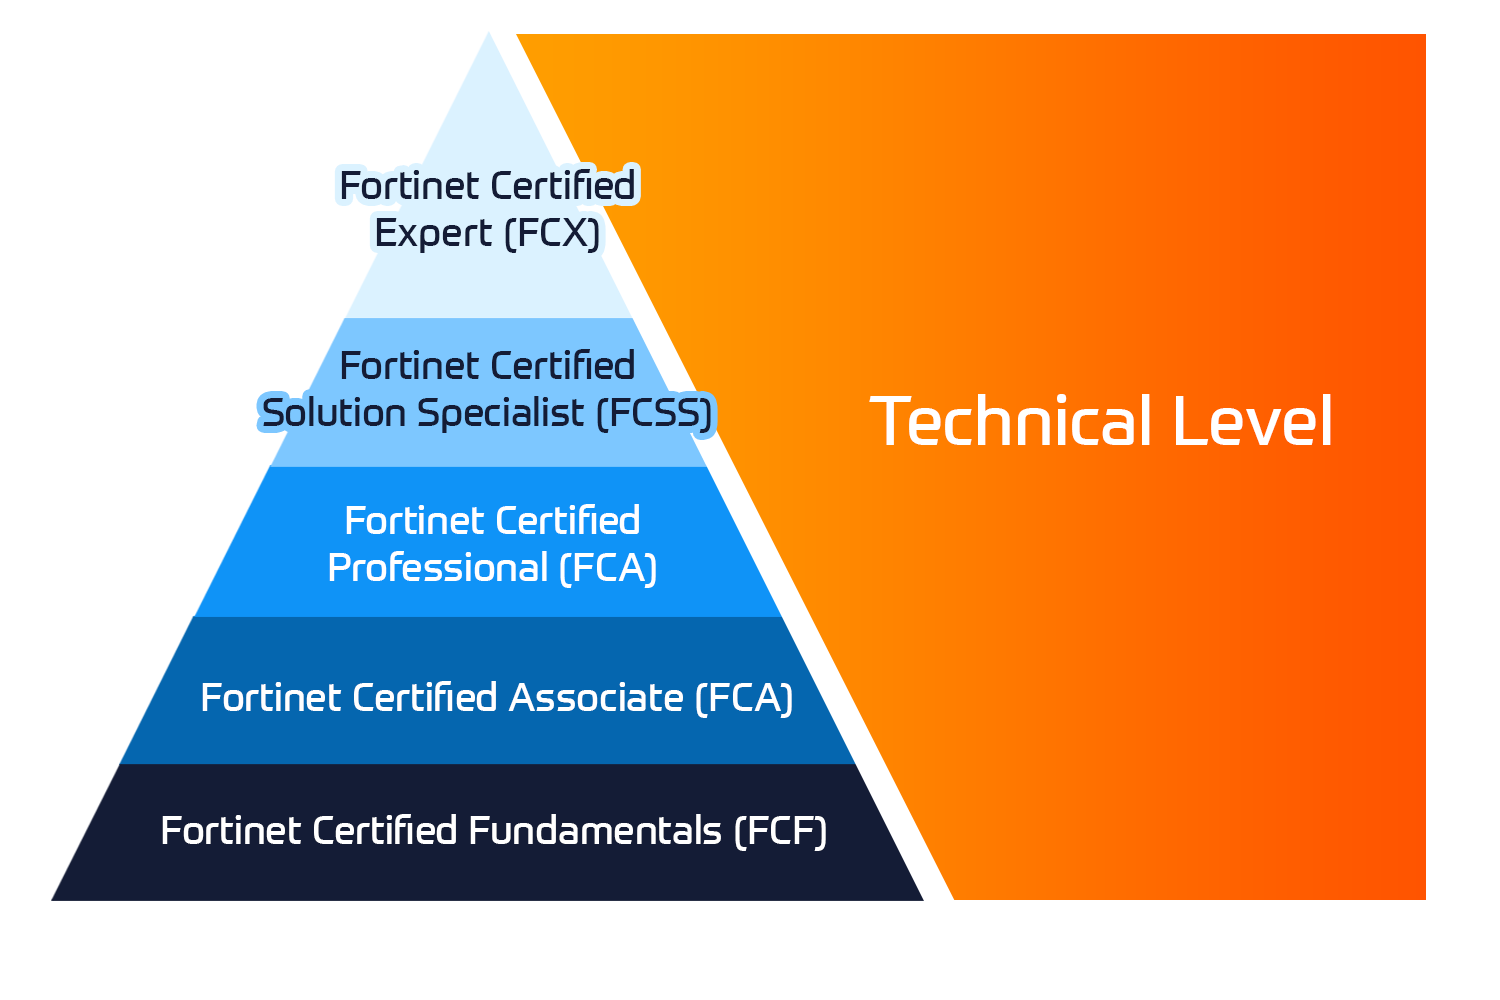
Fortinet Technical Certifications

The Fortinet Network Security Expert (NSE) program is an eight-level training and certification program to teach engineers of their network security for Fortinet FW skills and experience.

View More

Fortinet Technical Courses

Insoft is recognised as Fortinet Authorized Training Center in selected locations across EMEA.

View More

ATC Status

Check our ATC Status across selected countries in Europe.

View More

Fortinet Services Packages

Insoft Services has developed a specific solution to streamline and simplify the process of installing or migrating to Fortinet Products.

Browse Packages

Prepforce Bootcamp

The only comprehensive source available today to prepare for Fortinet NSE 8 certification globally.

View More

Microsoft Training

Insoft Services provides Microsoft training in EMEAR. We provide Microsoft technical training and certification courses that are led by world-class instructors.

View More

Technical Training

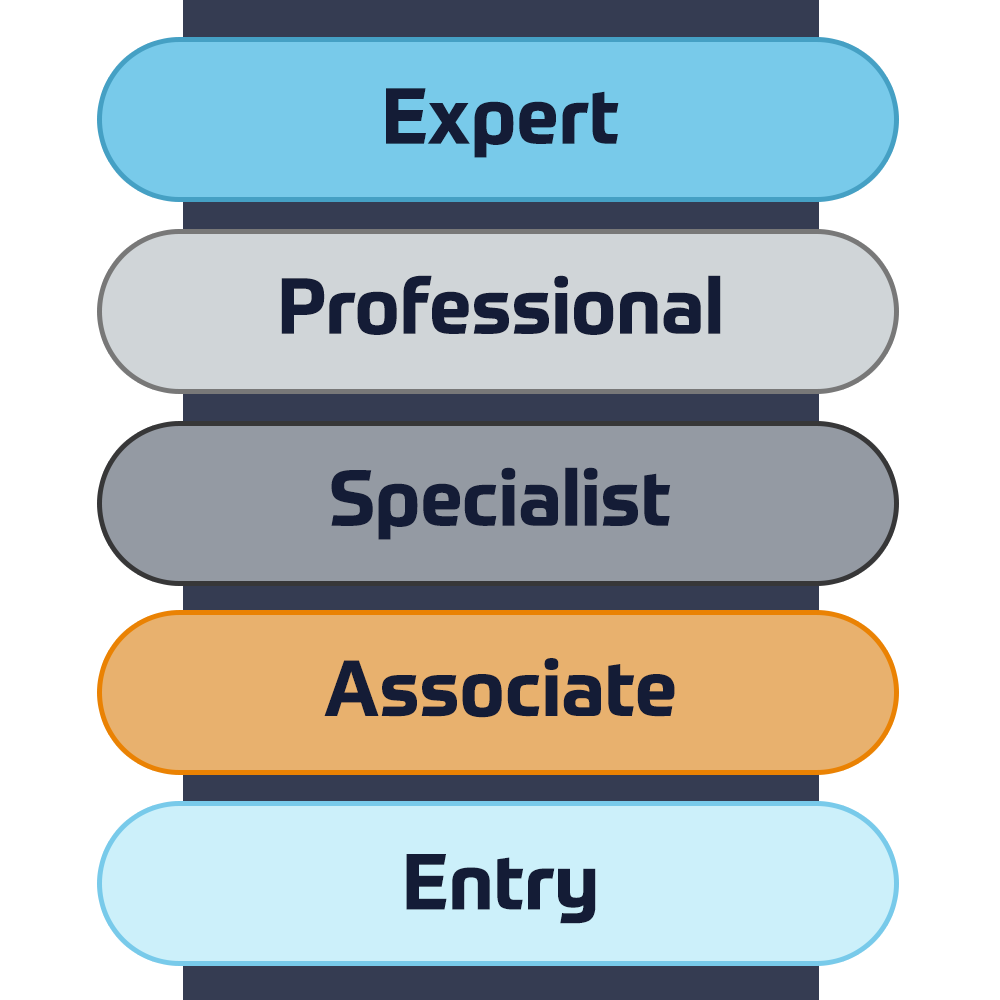
The evolution of Extreme Networks Technical Training provides a comprehensive progressive pathway from Associate to Professional accreditation.

View More

ATP Accreditation

As an authorised training partner (ATP), Insoft Services ensures that you receive the highest standards of education available.

View More

What we do

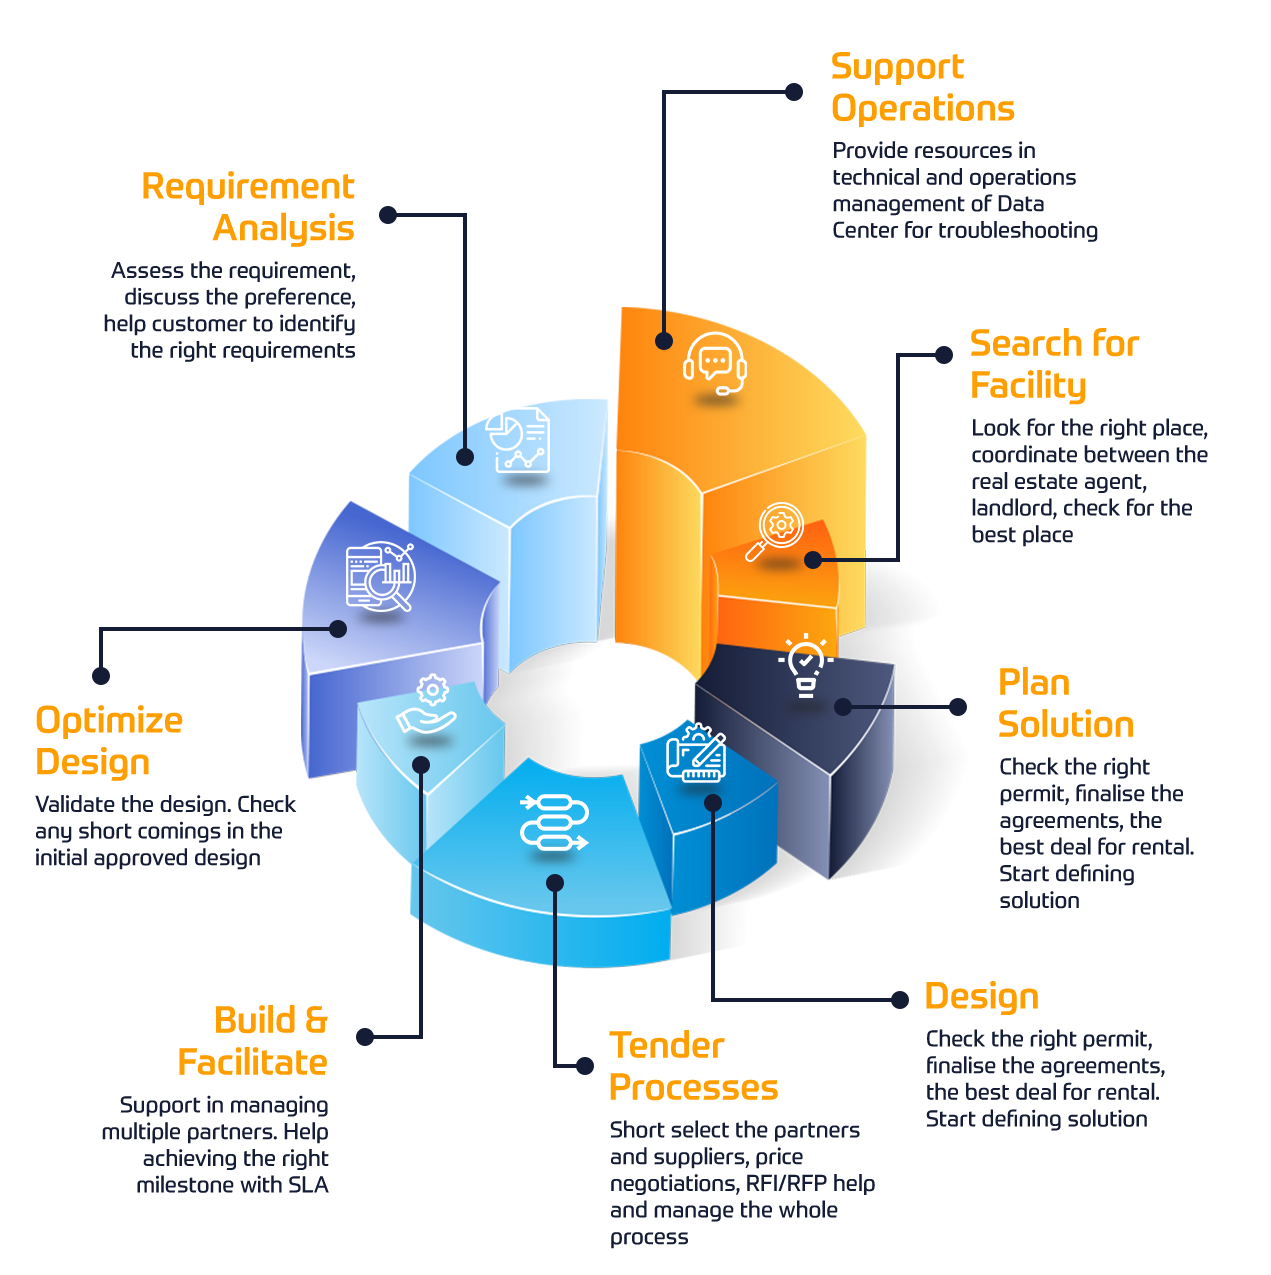
Through our global presence and partner ecosystem, we provide strategic IT consulting services to align IT services with customers' business goals.

View More


We are pleased to launch pre-scoped Enterprise Networking Consulting Packages, our ready-made solutions, tailored to ensure efficiency and cost containment.


View More


We specialize in the deployment of vendor-specific automation tools as well as open-source and vendor-independent solutions, that can be tuned in accordance with the business needs of a specific organization.


View More


In a world where technologies are evolving rapidly, every company - business needs a partner to rely on and trust for the smooth and secure operation of its network infrastructure.


View More


We provide comprehensive IoT consultancy, deployment and support solutions for businesses that want to launch or improve their use of connected technologies.

View More


In a world where technologies are evolving rapidly, every company - business needs a partner to rely on and trust for the smooth and secure operation of its network infrastructure.

View More


In a world where technologies are evolving rapidly, every company - business needs a partner to rely on and trust for the smooth and secure operation of its network infrastructure.

View More


In a world where technologies are evolving rapidly, every company - business needs a partner to rely on and trust for the smooth and secure operation of its network infrastructure.


View More


In a world where technologies are evolving rapidly, every company - business needs a partner to rely on and trust for the smooth and secure operation of its network infrastructure.


View More


We provide the highest level of expertise on Cisco consultancy services, that target audits of your current network and implementing updates for improved operational performance, secure data and compliant systems.

View More


We provide the highest level of expertise on Fortinet consultancy services that target audits of your current network and implementing updates for improved operational performance, secure data and compliant systems.

View More


Our team can help enterprises, get the most value from Extreme products and services following our predefined value-added packages or custom ones that fits business needs.


View More

About Us

Our training portfolio includes a wide range of IT training from IP providers, including Cisco, Extreme Networks, Fortinet, Microsoft, to name a few, in EMEA.

View More

Quick Powerful Graphics with Power View, PowerPivot, Power Query, Power Map and Power BI

Contact Us

We would love to hear from you. Please complete this form to pre-book or request further information about our delivery options.

Data Protection & Privacy

I hereby allow Insoft Ltd. to contact me on this topic. Further, I authorise Insoft Ltd. processing, using collecting and storing my personal data for the purpose of these activities. All your data will be protected and secured as outlined in our privacy policy.

Close

Quick Powerful Graphics with Power View, PowerPivot, Power Query, Power Map and Power BI

Enroll Now
Quick Powerful Graphics with Power View, PowerPivot, Power Query, Power Map and Power BI
Duration
2 Days
Delivery
(Online and onsite)
Price
Price Upon Request

This course is designed to teach the participant how to combine the functionality of Power View, PowerPivot, Power Query, and Power BI into graphs, charts, KPIs, reports, and other visualizations for use in their business. This course is lab example intensive.

  • Navigate the Power View interface.
  • Utilize Power View reports.
  • Work with tables.
  • Understand aggregations.
  • Utilize matrix.
  • Configure drill through.
  • Use cards as a visualization.
  • Apply filters.
  • Create charts.
  • Utilize tiles.
  • Add slicers to reports.
  • Utilize themes.
  • Navigate the PowerPivot interface.
  • Load data.
  • Examine and configure relationships.
  • Configure calculated columns are calculated fields.
  • Create PivotTables.
  • Understand and utilize DAX.
  • Use KPIs.
  • Work with hierarchies.
  • Manage perspectives.
  • Navigate the Power Query interface.
  • Load data.
  • Filter data.
  • Merge datasets.
  • Manage modifications.
  • Perform data cleaning.
  • Navigate the Power Map interface.
  • Use Bing maps.
  • Examine map data.
  • Configure tours, scenes, and layers.
  • Add time to a presentation.
  • Navigate the Power BI interface.
  • Utilize data sources.
  • Understand querying with natural language.

Module 1: Course Overview

This module explains how the class will be structured and introduces course materials and additional administrative information.

Lessons

  • Introduction
  • Course Materials
  • Facilities
  • Prerequisites
  • What We’ll Be Discussing

Lab 1: Course Overview

  • None

After completing this module, students will be able to:

  • Successfully log into their virtual machine.
  • Have a full understanding of what the course intends to cover.


Module 2: Power View

In this module, we will explore Power View and its capabilities, then briefly walk-through the types of reports available and how to format them.

Lessons

  • Exploring the Power View Interface
  • Visualizing Power View Reports
  • Working with Tables
  • Understanding Aggregations
  • Utilizing Matrix
  • Configuring Drill Through
  • Using Cards
  • Applying Filters
  • Creating Charts
  • Examining Tiles
  • Adding Slicers to Reports
  • Theming Reports

Lab 1: Power View

  • Power View Interface
  • Working with Tables
  • Aggregations
  • Matrix
  • Drill Through
  • Cards
  • Filters
  • Charts
  • Tiles
  • Adding Slicers to Reports

After completing this module, students will be able to:

  • Navigate the Power View interface.
  • Utilize Power View reports.
  • Work with tables.
  • Understand aggregations.
  • Utilize matrix.
  • Configure drill through.
  • Use cards as a visualization.
  • Apply filters.
  • Create charts.
  • Utilize tiles.
  • Add slicers to reports.
  • Utilize themes.


Module 3: PowerPivot

In this module, we will explore PowerPivot and its capabilities, then briefly walk-through the options available and how to configure them.

Lessons

  • Exploring the PowerPivot Interface
  • Loading Data
  • Examining Relationships
  • Configuring Calculated Columns and Calculated Fields
  • Creating PivotTables
  • Understanding DAX
  • Utilizing DAX Functions
  • Using KPIs
  • Working with Hierarchies
  • Managing Perspectives

Lab 1: PowerPivot

  • Introduction to the PowerPivot Interface
  • Importing Data
  • Importing Large Datasets
  • Importing Data with a Query
  • Creating Relationships
  • Creating a Cascading Relationship
  • Hiding Columns, Change Data Type, Sorting, and Filtering
  • Calculated Columns and Calculated Fields
  • KPIs
  • Hierarchies
  • Perspectives

After completing this module, students will be able to:

  • Navigate the PowerPivot interface.
  • Load data.
  • Examine and configure relationships.
  • Configure calculated columns are calculated fields.
  • Create PivotTables.
  • Understand and utilize DAX.
  • Use KPIs.
  • Work with hierarchies.
  • Manage perspectives.


Module 4: Power Query

In this module, we will delve into the benefits and features provided using Power Query. We will examine the options available within the ribbon, as well as explore and demonstrate importing, filtering, and merging data using Power Query.

Lessons

  • Exploring The Power Query Interface
  • Loading Data
  • Managing Modifications
  • Examining Data Cleaning

Lab 1: Power Query

  • Getting External Data
  • Data Filtering
  • Merging Datasets

After completing this module, students will be able to:

  • Navigate the Power Query interface.
  • Load data.
  • Filter data.
  • Merge datasets.
  • Manage modifications.
  • Perform data cleaning.


Module 5: Power Map

In this module we will explore Power Map and its capabilities.

Lessons

  • Exploring The Power Map Interface
  • Using Bing Maps
  • Examining Map Data
  • Reviewing Map Types and Presentation

Lab 1: Power Map

  • View Power Map in Action
  • Geocoding
  • Tours, Scenes, and Layers
  • Adding Time

After completing this module, students will be able to:

  • Navigate the Power Map interface.
  • Use Bing maps.
  • Examine map data.
  • Configure tours, scenes, and layers.
  • Add time to a presentation.


Module 6: Introduction to Power BI

In this module, we will explore the Power BI interface and walk-through the options available.

Lessons

  • Introducing Power BI
  • Explaining Excel and Power BI
  • Examining Data Sources
  • Querying with Natural Language

Lab 1: Introduction to Power BI

  • Introduction to Power BI
  • Data Sources

After completing this module, students will be able to:

  • Navigate the Power BI interface.
  • Utilize data sources.
  • Understand querying with natural language.

The course is targeted towards business analysts, business intelligence developers, and reporting professionals.

Working knowledge of Excel

This course is designed to teach the participant how to combine the functionality of Power View, PowerPivot, Power Query, and Power BI into graphs, charts, KPIs, reports, and other visualizations for use in their business. This course is lab example intensive.
  • Navigate the Power View interface.
  • Utilize Power View reports.
  • Work with tables.
  • Understand aggregations.
  • Utilize matrix.
  • Configure drill through.
  • Use cards as a visualization.
  • Apply filters.
  • Create charts.
  • Utilize tiles.
  • Add slicers to reports.
  • Utilize themes.
  • Navigate the PowerPivot interface.
  • Load data.
  • Examine and configure relationships.
  • Configure calculated columns are calculated fields.
  • Create PivotTables.
  • Understand and utilize DAX.
  • Use KPIs.
  • Work with hierarchies.
  • Manage perspectives.
  • Navigate the Power Query interface.
  • Load data.
  • Filter data.
  • Merge datasets.
  • Manage modifications.
  • Perform data cleaning.
  • Navigate the Power Map interface.
  • Use Bing maps.
  • Examine map data.
  • Configure tours, scenes, and layers.
  • Add time to a presentation.
  • Navigate the Power BI interface.
  • Utilize data sources.
  • Understand querying with natural language.

Module 1: Course Overview

This module explains how the class will be structured and introduces course materials and additional administrative information.

Lessons

  • Introduction
  • Course Materials
  • Facilities
  • Prerequisites
  • What We’ll Be Discussing

Lab 1: Course Overview

  • None

After completing this module, students will be able to:

  • Successfully log into their virtual machine.
  • Have a full understanding of what the course intends to cover.


Module 2: Power View

In this module, we will explore Power View and its capabilities, then briefly walk-through the types of reports available and how to format them.

Lessons

  • Exploring the Power View Interface
  • Visualizing Power View Reports
  • Working with Tables
  • Understanding Aggregations
  • Utilizing Matrix
  • Configuring Drill Through
  • Using Cards
  • Applying Filters
  • Creating Charts
  • Examining Tiles
  • Adding Slicers to Reports
  • Theming Reports

Lab 1: Power View

  • Power View Interface
  • Working with Tables
  • Aggregations
  • Matrix
  • Drill Through
  • Cards
  • Filters
  • Charts
  • Tiles
  • Adding Slicers to Reports

After completing this module, students will be able to:

  • Navigate the Power View interface.
  • Utilize Power View reports.
  • Work with tables.
  • Understand aggregations.
  • Utilize matrix.
  • Configure drill through.
  • Use cards as a visualization.
  • Apply filters.
  • Create charts.
  • Utilize tiles.
  • Add slicers to reports.
  • Utilize themes.


Module 3: PowerPivot

In this module, we will explore PowerPivot and its capabilities, then briefly walk-through the options available and how to configure them.

Lessons

  • Exploring the PowerPivot Interface
  • Loading Data
  • Examining Relationships
  • Configuring Calculated Columns and Calculated Fields
  • Creating PivotTables
  • Understanding DAX
  • Utilizing DAX Functions
  • Using KPIs
  • Working with Hierarchies
  • Managing Perspectives

Lab 1: PowerPivot

  • Introduction to the PowerPivot Interface
  • Importing Data
  • Importing Large Datasets
  • Importing Data with a Query
  • Creating Relationships
  • Creating a Cascading Relationship
  • Hiding Columns, Change Data Type, Sorting, and Filtering
  • Calculated Columns and Calculated Fields
  • KPIs
  • Hierarchies
  • Perspectives

After completing this module, students will be able to:

  • Navigate the PowerPivot interface.
  • Load data.
  • Examine and configure relationships.
  • Configure calculated columns are calculated fields.
  • Create PivotTables.
  • Understand and utilize DAX.
  • Use KPIs.
  • Work with hierarchies.
  • Manage perspectives.


Module 4: Power Query

In this module, we will delve into the benefits and features provided using Power Query. We will examine the options available within the ribbon, as well as explore and demonstrate importing, filtering, and merging data using Power Query.

Lessons

  • Exploring The Power Query Interface
  • Loading Data
  • Managing Modifications
  • Examining Data Cleaning

Lab 1: Power Query

  • Getting External Data
  • Data Filtering
  • Merging Datasets

After completing this module, students will be able to:

  • Navigate the Power Query interface.
  • Load data.
  • Filter data.
  • Merge datasets.
  • Manage modifications.
  • Perform data cleaning.


Module 5: Power Map

In this module we will explore Power Map and its capabilities.

Lessons

  • Exploring The Power Map Interface
  • Using Bing Maps
  • Examining Map Data
  • Reviewing Map Types and Presentation

Lab 1: Power Map

  • View Power Map in Action
  • Geocoding
  • Tours, Scenes, and Layers
  • Adding Time

After completing this module, students will be able to:

  • Navigate the Power Map interface.
  • Use Bing maps.
  • Examine map data.
  • Configure tours, scenes, and layers.
  • Add time to a presentation.


Module 6: Introduction to Power BI

In this module, we will explore the Power BI interface and walk-through the options available.

Lessons

  • Introducing Power BI
  • Explaining Excel and Power BI
  • Examining Data Sources
  • Querying with Natural Language

Lab 1: Introduction to Power BI

  • Introduction to Power BI
  • Data Sources

After completing this module, students will be able to:

  • Navigate the Power BI interface.
  • Utilize data sources.
  • Understand querying with natural language.

The course is targeted towards business analysts, business intelligence developers, and reporting professionals.

Working knowledge of Excel

    Upcoming Dates
  • ` Jul 3 - Jul 4, 2023
  • ` Jul 31 - Aug 1, 2023
  • ` Aug 28 - Aug 29, 2023
  • ` Sep 25 - Sep 26, 2023
  • ` Oct 23 - Oct 24, 2023
  • ` Nov 20 - Nov 21, 2023