Cisco Training Courses

Insoft has been serving IT community with official Cisco training offering since 2010. Find all the relevant information on Cisco training on this page.

View More

Cisco Certifications

Experience a blended learning approach that combines the best of instructor-led training and self-paced e-learning to help you prepare for your certification exam.

View More

Cisco Learning Credits

Cisco Learning Credits (CLCs) are prepaid training vouchers redeemed directly with Cisco that make planning for your success easier when purchasing Cisco products and services.

Have CLCs and want to redeem them?

Cisco Continuing Education

The Cisco Continuing Education Program offers all active certification holders flexible options to recertify by completing a variety of eligible training items.

View More

Cisco Business Enablement

The Cisco Business Enablement Partner Program focuses on sharpening the business skills of Cisco Channel Partners and customers.

View More

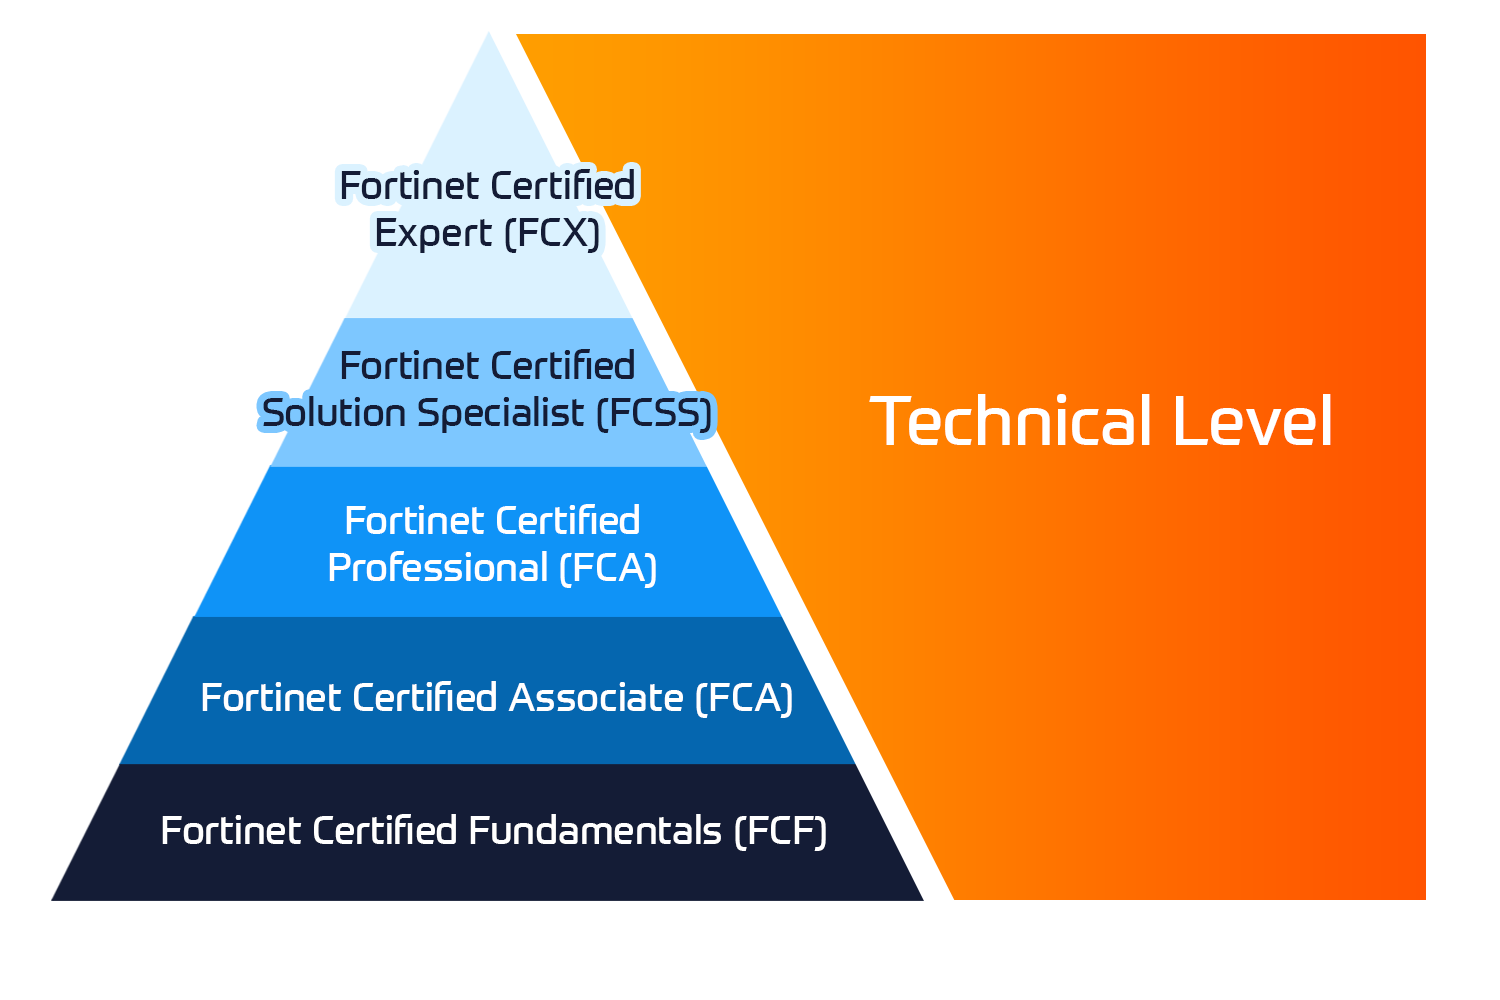
Fortinet Technical Certifications

The Fortinet Network Security Expert (NSE) program is an eight-level training and certification program to teach engineers of their network security for Fortinet FW skills and experience.

View More

Fortinet Technical Courses

Insoft is recognised as Fortinet Authorized Training Center in selected locations across EMEA.

View More

ATC Status

Check our ATC Status across selected countries in Europe.

View More

Fortinet Services Packages

Insoft Services has developed a specific solution to streamline and simplify the process of installing or migrating to Fortinet Products.

Browse Packages

Prepforce Bootcamp

The only comprehensive source available today to prepare for Fortinet NSE 8 certification globally.

View More

Microsoft Training

Insoft Services provides Microsoft training in EMEAR. We provide Microsoft technical training and certification courses that are led by world-class instructors.

View More

Technical Training

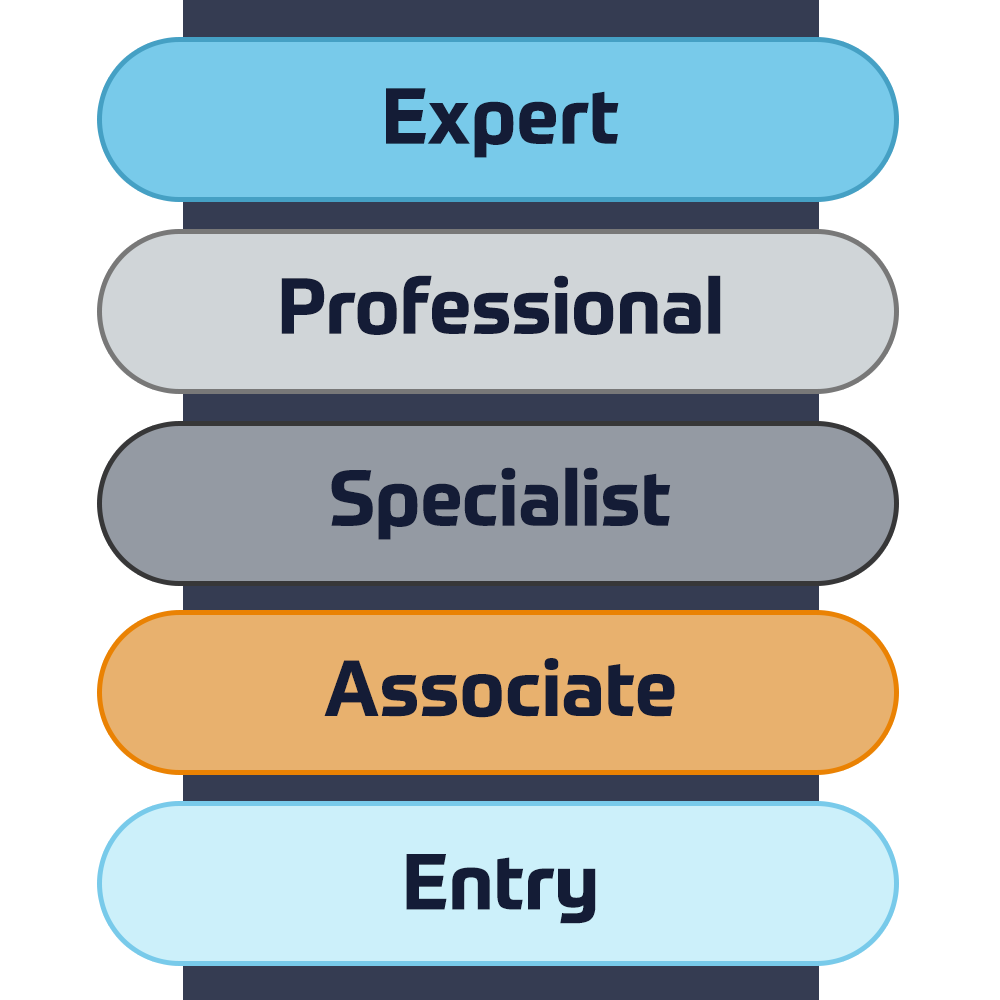
The evolution of Extreme Networks Technical Training provides a comprehensive progressive pathway from Associate to Professional accreditation.

View More

ATP Accreditation

As an authorised training partner (ATP), Insoft Services ensures that you receive the highest standards of education available.

View More

What we do

Through our global presence and partner ecosystem, we provide strategic IT consulting services to align IT services with customers' business goals.

View More


We are pleased to launch pre-scoped Enterprise Networking Consulting Packages, our ready-made solutions, tailored to ensure efficiency and cost containment.


View More


We specialize in the deployment of vendor-specific automation tools as well as open-source and vendor-independent solutions, that can be tuned in accordance with the business needs of a specific organization.


View More


In a world where technologies are evolving rapidly, every company - business needs a partner to rely on and trust for the smooth and secure operation of its network infrastructure.


View More


We provide comprehensive IoT consultancy, deployment and support solutions for businesses that want to launch or improve their use of connected technologies.

View More


In a world where technologies are evolving rapidly, every company - business needs a partner to rely on and trust for the smooth and secure operation of its network infrastructure.

View More


In a world where technologies are evolving rapidly, every company - business needs a partner to rely on and trust for the smooth and secure operation of its network infrastructure.

View More


In a world where technologies are evolving rapidly, every company - business needs a partner to rely on and trust for the smooth and secure operation of its network infrastructure.


View More


In a world where technologies are evolving rapidly, every company - business needs a partner to rely on and trust for the smooth and secure operation of its network infrastructure.


View More


We provide the highest level of expertise on Cisco consultancy services, that target audits of your current network and implementing updates for improved operational performance, secure data and compliant systems.

View More


We provide the highest level of expertise on Fortinet consultancy services that target audits of your current network and implementing updates for improved operational performance, secure data and compliant systems.

View More


Our team can help enterprises, get the most value from Extreme products and services following our predefined value-added packages or custom ones that fits business needs.


View More

About Us

Our training portfolio includes a wide range of IT training from IP providers, including Cisco, Extreme Networks, Fortinet, Microsoft, to name a few, in EMEA.

View More

Writing Reports with Report Designer and SSRS 2016 Level 2

Contact Us

We would love to hear from you. Please complete this form to pre-book or request further information about our delivery options.

Data Protection & Privacy

I hereby allow Insoft Ltd. to contact me on this topic. Further, I authorise Insoft Ltd. processing, using collecting and storing my personal data for the purpose of these activities. All your data will be protected and secured as outlined in our privacy policy.

Close

Writing Reports with Report Designer and SSRS 2016 Level 2

Enroll Now
Writing Reports with Report Designer and SSRS 2016 Level 2
Duration
2 Days
Delivery
(Online and onsite)
Price
Price Upon Request

In this 2-day course, students will continue their learning on the foundations of report writing with Microsoft® SQL Server® Report Designer and SSRS. The focus will be on report creation by connecting to a database and manipulating the data for presentation including: creating parameter reports, creating list reports, adding complex expressions to reports, adding images and subreports to reports, adding drilldown and drillthrough functionality, and adding sparklines, data bars, and indicators to reports.

Report Designer is available for all supported versions of Microsoft® SQL Server®.

  • Create parameter reports.
  • Create list reports.
  • Format reports with complex expressions.
  • Add images and subreports.
  • Add drilldown and drillthrough functionality.
  • Add sparklines, data bars, and indicators.

Module 1: Parameter Reports

This module introduces the use of the parameter in report writing. Parameters allow a level of self-service reporting wherein the report audience can choose the data to view (date range, department, geography, etc.).

Lessons

  • Parameterized Reporting
  • Create Report Parameters
  • Modify Report Parameters
  • Provide Default Parameter Values
  • Provide Available Values for Parameters

Lab 1: Creating Parameterized Reports

  • Create Single Value Parameter Reports
  • Create Multi-Value Parameter Reports
  • Create an Available Values Parameter Report
  • Create a Parameter Report with Default Values
  • Modify Existing Parameter Reports

After completing this module, students will be able to:

  • Describe the key benefits and features of report parameters.
  • Create parameterized queries and parameterized reports.
  • Create parameters which accept single values, multiple values, expose or hide the parameter value, provide a list of available parameter values, and provide parameters with default values.
  • Modify existing parameters and parameter reports.


Module 2: List Data Regions

This module introduces the list data region. List data regions allow report writers free-form control over their reports, whereas, table and matrix reports bind you to a table or matrix data presentation. This free-form feature affords the report writer the ability to truly customize the report.

Lessons

  • Introducing the List Data Region
  • Create Reports Using List Data Regions
  • Modify Reports Which Use List Data Regions

Lab 1: Creating List Reports

  • Create a Multiple Column Report with List Data Regions
  • Create a Report with Rectangles and Nested Data
  • Create an Enhanced Report with Rectangles and List Data Regions

After completing this module, students will be able to:

  • Describe the benefits of list data regions and rectangles in reporting scenarios.
  • Create reports which display data in multiple columns.
  • Create reports which take advantage of nested data.
  • Create enhanced reports using list data regions and rectangles.


Module 3: Enhancing Reports with Complex Expressions

This module introduces several new report formatting techniques which allow the report writer better control over the data displayed in the report.

Lessons

  • Formatting Reports
  • Top N Reports
  • Running Values

Lab 1: Enhancing Reports with Complex Expressions

  • Create Conditional Formats for Data
  • Use Complex Expressions in Charts
  • Calculate Running Values in Table and Matrix Data Regions
  • Create TOP N Reports
  • Add Row Banding in Table and Matrix Reports

After completing this module, students will be able to:

  • Create conditional formats for data displayed in a report.
  • Use complex expressions in charts.
  • Calculate running values for groups and datasets.
  • Create TOP N reports for groups and datasets.
  • Use row banding in a data region.


Module 4: Enhance Reports with Images and Subreports

In this module, students will add images and reports (subreports) to reports, tour and students will be introduced to SSRS (SQL Server Reporting Services).

Lessons

  • Add Images to Reports
  • Retrieve Images from a Database
  • Introducing SSRS (SQL Server Reporting Services) Report Server
  • Add Subreports to Reports

Lab 1: Working With Images and Subreports

  • Add an Image to an Existing Report
  • Display Images from a Database in a Report
  • Format HTML5 Data to Display Properly in a Report
  • Use SSRS Report Server to Facilitate Subreporting
  • Add Subreports to a Report
  • Add Parameterized Subreports to Reports

After completing this module, students will be able to:

  • Describe the available options for adding images to reports.
  • Add images to reports.
  • Describe the features of SSRS Report Server
  • Add subreports and parameterized subreports to reports.


Module 5: Drilldown and Drillthrough Reports

This module introduces the ToggleByItem and Action properties to incorporate drilldowns and drillthrough reporting.

Lessons

  • Add and Configure Drilldown Reporting
  • Add and Configure Drillthrough Reporting

Lab 1: Add Drilldown and Drillthrough Functionality to Reports

  • Add Drilldown Functionality to Text Boxes
  • Add Drilldown Functionality to Groups
  • Add Drilldown Functionality to Group Hierarchies
  • Add Drillthrough Functionality to a Report
  • Add Parameterized Drillthrough Functionality to a Chart

After completing this module, students will be able to:

  • Describe the key features of drilldowns and drillthroughs in a report.
  • Add drilldowns to Reports.
  • Add drillthroughs to Reports.
  • Add parameterized drillthroughs to Reports.


Module 6: Sparklines, Data Bars, and Indicators

This module introduces the ability to create and add charts to reports. Whether through wizard or individual effort, chart reports or charts as report components allow us to visualize data with or without the details.

Lessons

  • Sparklines
  • Data Bars
  • Indicators

Lab 1: Adding Sparklines, Data Bars, and Indicators to Reports

  • Create Group Charts
  • Add Indicators and Data Bars to a Report
  • Add Sparklines to a Report
  • Add Indicators to a Report
  • Add Sparklines, Data Bars, and Indicators to a Report

After completing this module, students will be able to:

  • Describe the key features of incorporating mini-charts and mini-gauges in reports.
  • Add and modify sparklines, data bars, and indicators in reports.

The primary audience for this course are persons who are new to reporting with Microsoft® SQL Server® Report Designer and SSRS, persons who are transitioning from another reporting software application, and persons who are existing Report Builder and SSRS report authors.

The secondary audience for this course are persons who are using Report Builder (SSRS).

Course participants may be business analysts, programmer analysts, data analysts, database administrators, or IT professionals and may or may not have experience with Microsoft® SQL Server® Report Builder and SSRS, programming (Visual Basic), and/or Transact-Structured Query Language (T-SQL) experience.

  • Familiarity with Windows.
  • Creating and navigating folders.
  • Opening programs.
  • Manipulating windows.
  • Copying and pasting objects.
  • Formatting text.
  • Saving files.
    Upcoming Dates
  • ` Jul 3 - Jul 4, 2023
  • ` Jul 31 - Aug 1, 2023
  • ` Aug 28 - Aug 29, 2023
  • ` Sep 25 - Sep 26, 2023
  • ` Oct 23 - Oct 24, 2023
  • ` Nov 20 - Nov 21, 2023