 Finland
 Germany
 Denmark
 Sweden
 Italy
Italy Netherlands
 Norway


IT Training : Unleash Your Skills
Discover our vast majority of accredited and vendor independent IT training courses

Promo Courses
We Deliver World-Class IT Training Services
Cisco Training
We provide authorized Cisco certification & specialized technical training
Learn MoreMicrosoft Training
Equip yourself with basic and advanced levels of the Microsoft courses
Learn More


Cisco Training
We provide authorized Cisco certification & specialized technical training
Learn More
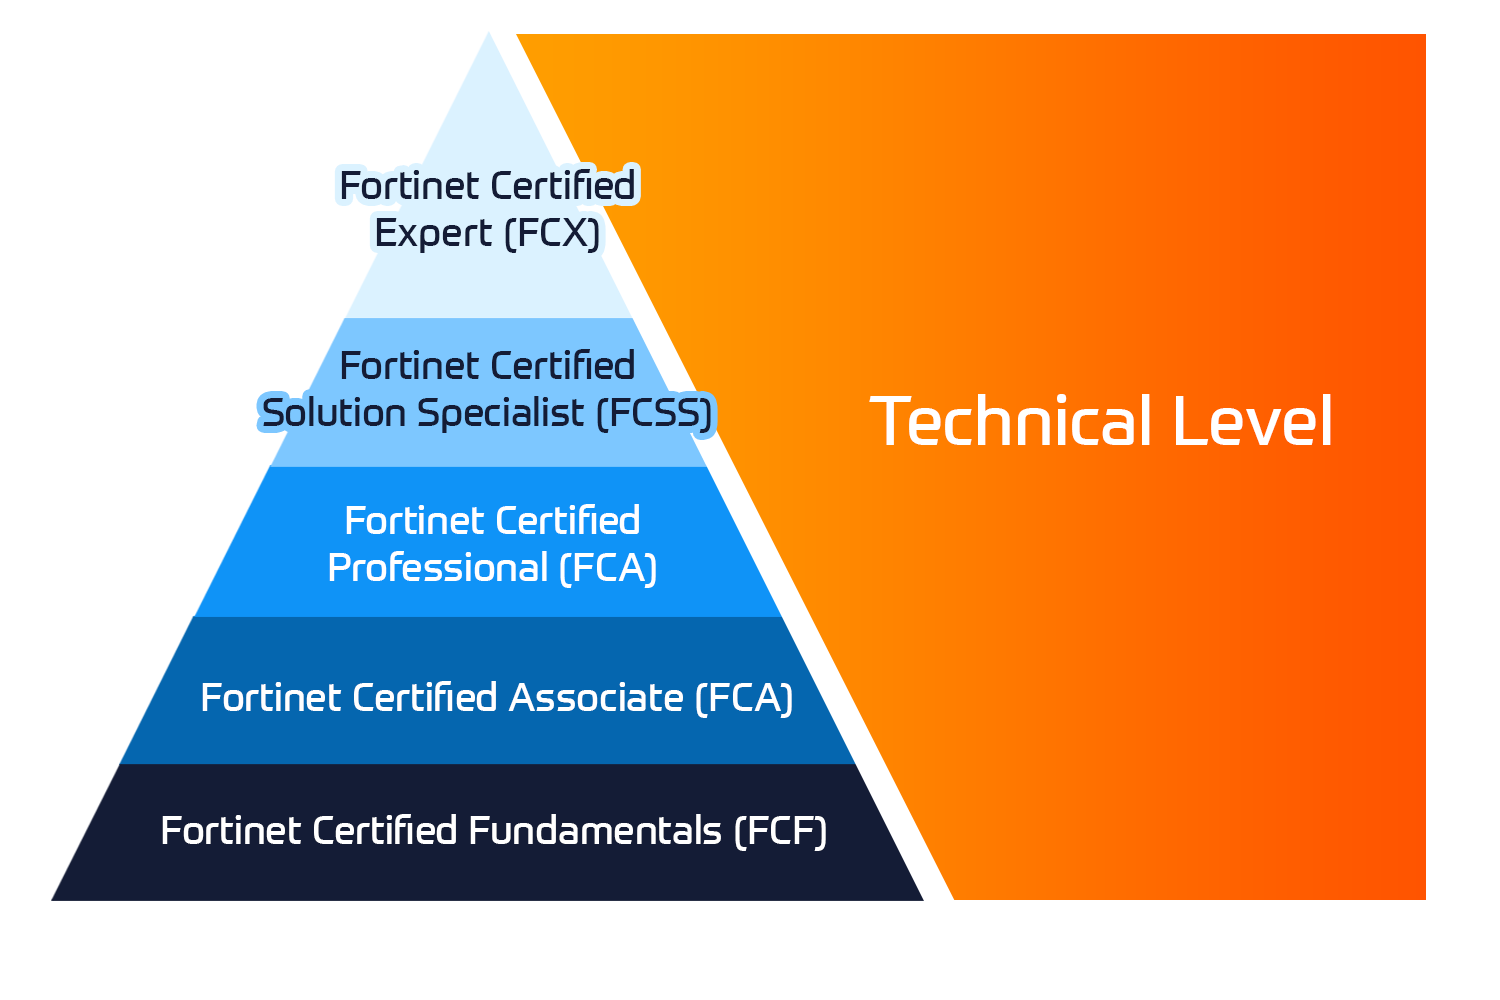
Fortinet Training
We provide authorized training on all NSE certification levels certification levels
Learn More
Microsoft Training
Equip yourself with basic and advanced levels of the Microsoft courses
Learn MoreConsult with us
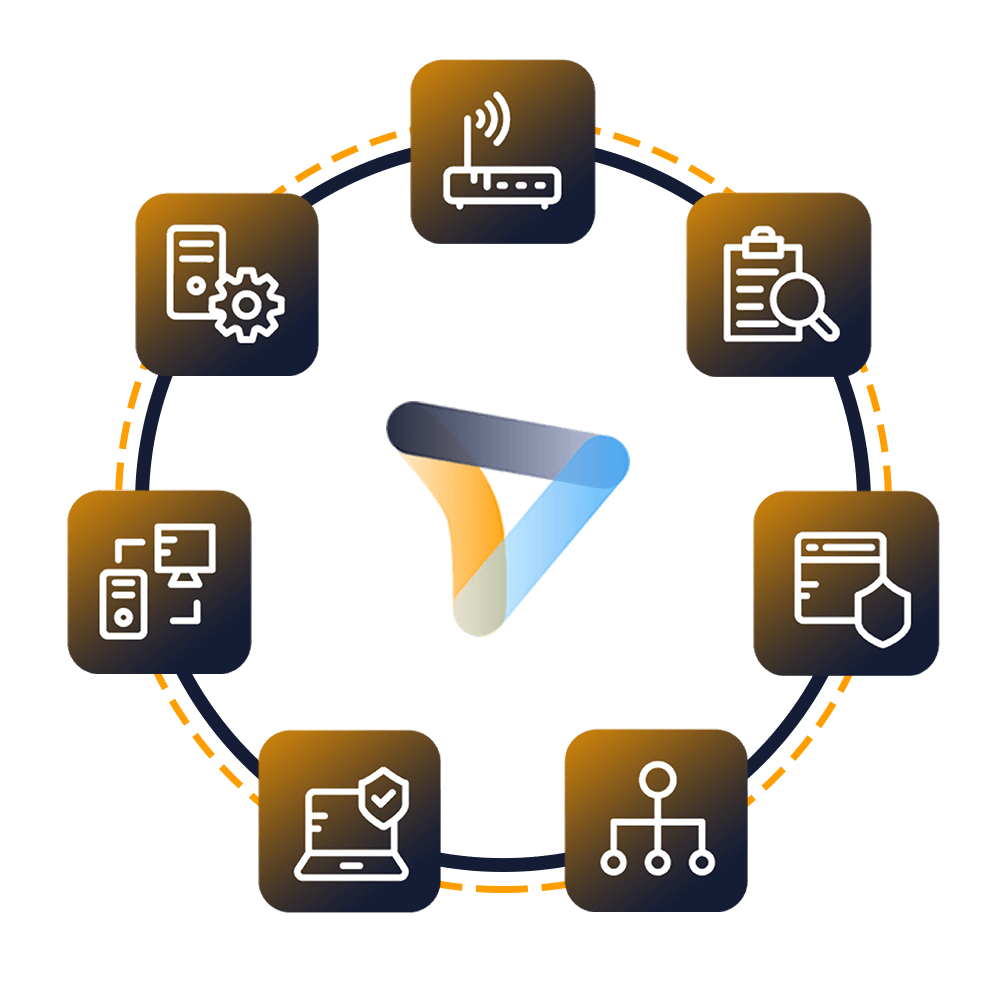
We have gathered the most experienced team of Subject Matter Experts (SMEs) to tackle the challenges related to migrating classical IP networks head-on.
Our Consulting Services focus on designing, migrating and optimizing IP based network solutions through the brand new SDN technology advancements.
Start Learning At Your Own Pace
Check Our Popular eLearning Courses Covering DevOps, Network Automation, Cybersecurity, and more.


Here´s some of our Project Briefs from our Customers


Since 2010, Insoft has been managing multiple projects for Juniper Networks. We have been providing Professional Services directly to Juniper as well as to various customers of Juniper Networks as a professional services partner.

Insoft has been helping Fortinet customers since 2014. We have been securing customer networks by migrating firewalls, redesigning policies and recently working on FortiGate SD-WAN deployments. Fortinet Consultancy Packages are created in order to provide a cost-effective option addressing all aspects.
The increase of support from Palo Alto´s customers required further workforce. We support the EMEA Labs projects on a regular basis. Insoft Services manages the Global Labs Infrastructure, which includes on-premise and virtual devices from Palo Alto to replicate any custom configuration.

Since 2012, Insoft has helped Telia at multiple levels from Smart City projects in the city of Turku as well as helping them on supporting their skillset on at least 25+ projects around Nordics.
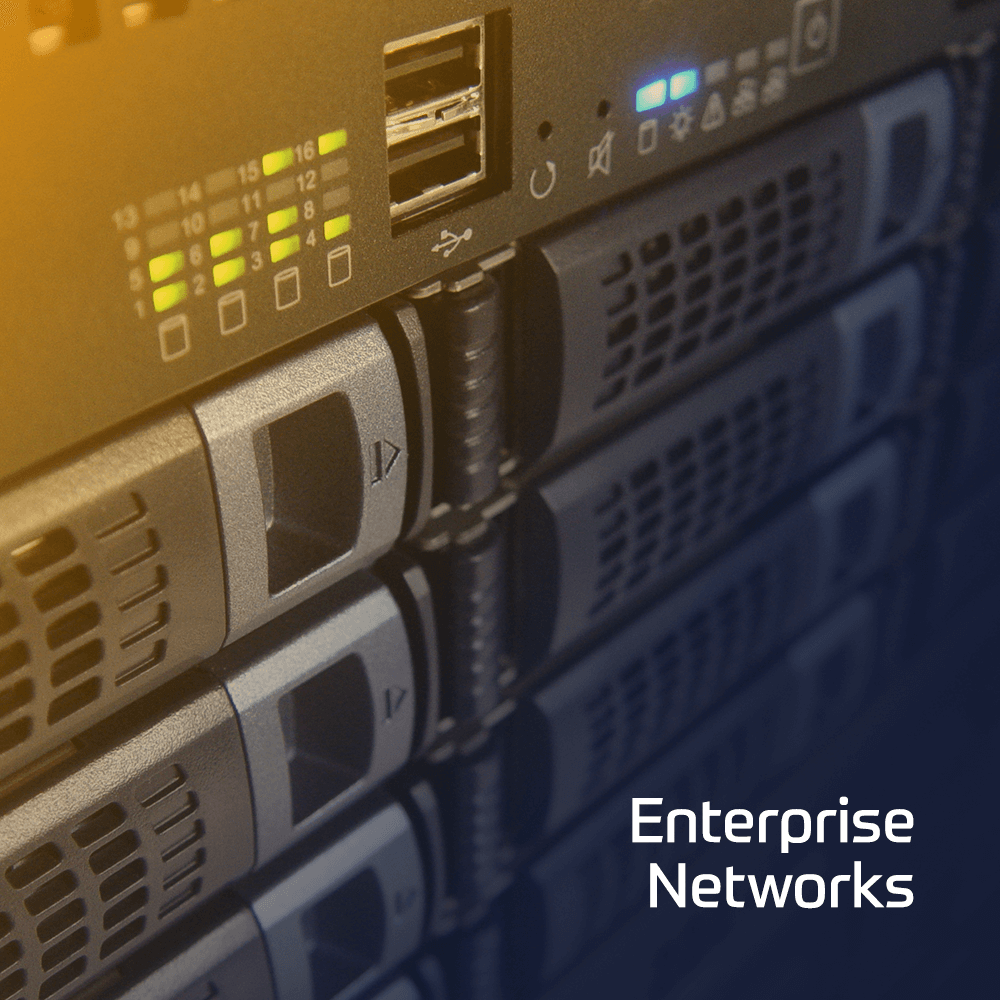
Networks are Evolving, Are you?
Specialise in Network Automation and Rolling out large size Zero touch Deployments